

Imagine this scenario: A couple walks into your boutique hotel’s lobby. They are dragging Rimowa suitcases. They look around at your art-deco lighting and smile. They walk up to the front desk, ask about the King Suite, and nod happily at the price. You hand them the registration card to sign.
Suddenly, without a word, they drop the pen, turn around, and sprint out the front door.
You would be chasing them down the street, right? “Was it something I said? Was the pen out of ink? Did you see a ghost?”
In the physical world, this behavior is insane. In the digital world, it happens on your website about 80% of the time.
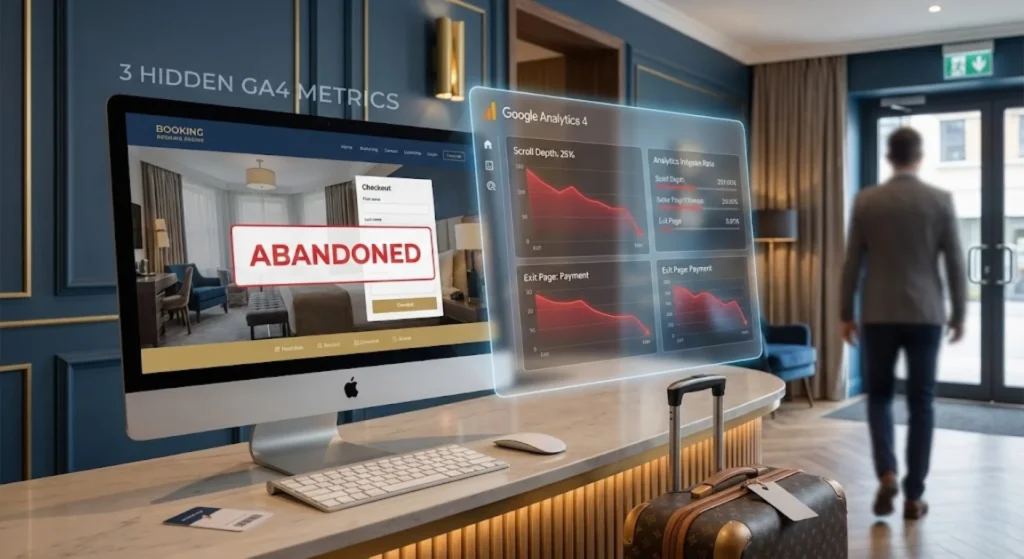
We call it “Booking Abandonment,” but let’s call it what it really is: The Silent Walk-Out.
Most hoteliers look at their basic dashboard, see a high “Bounce Rate,” and shrug. “I guess they were just browsing,” they say. But as a Web Analytics expert, I can tell you: Guests don’t just ‘browse’ with a credit card in their hand. Usually, we pushed them away.
The good news? The clues to why they left are hiding in plain sight within your Google Analytics 4 (GA4) account. You just need to know where to look.
Here are the 3 “hidden” metrics that tell the real story of your lost revenue.
1. The “Checkout Journey” Funnel (The Specific Step of Death)
Most hotel marketing dashboards show you two numbers:
- How many people visited.
- How many people booked.
This is useless. It’s like knowing 100 people entered a maze and only 2 came out, without knowing where the other 98 got lost.
The Hidden Metric: GA4 has a specific report often buried under the “Monetization” tab called the Checkout Journey. Unlike the old “Goal Flow,” this visualizes the exact cliff where your potential guest fell off.
How to Read It Like a Human: Look at the gap between “Begin Checkout” and “Add Payment Info.”
- The Scenario: You see a 60% drop here.
- The Human Translation: “I was ready to book, but then I saw the ‘Taxes & Resort Fees’ added to the total, and I felt tricked.” Or, “I wanted to pay with Apple Pay, but you only accept Visa.”
The Fix: If the drop is at the Payment step, audit your hidden fees. If the drop is at the Details step, your form is likely too long. Do you really need their home address and company name just to reserve a room? Cut the friction.
2. Scroll Depth on “Room Details” (The “interest” Lie)
We often assume that if a user spent 2 minutes on the “Luxury Suite” page, they were interested. But time is deceptive. They could have left the tab open while making coffee.
The Hidden Metric: Scroll Depth (specifically the 25%, 50%, and 90% scroll events).
How to Read It Like a Human: Compare your Scroll Depth against your “Book Now” button clicks.
- The Scenario: 5,000 people visit your “Suites” page. 80% of them scroll only 25% down the page.
- The Human Translation: Your hero image (the big photo at the top) isn’t doing its job. Or worse, your “Book Now” button is buried at the bottom of the page (the footer), and 80% of your visitors never even see it.
The Fix: Stop playing “Hide and Seek” with your revenue. If GA4 says users aren’t scrolling past the 50% mark, move your best photos, your strongest social proof (reviews), and your “Check Availability” button to the top 30% of the page.
3. Core Web Vitals vs. Session Duration (The “Patience” Test)
This is the most painful one to admit. Sometimes, the problem isn’t your price. It isn’t your photos. It’s your code.
In 2026, the human attention span is shorter than that of a goldfish. If your booking engine takes 4 seconds to load on a mobile phone, that guest is already back on Expedia.
The Hidden Metric: In GA4, we look at User Engagement overlaid with Tech > Device Category. Specifically, look for a discrepancy between Desktop and Mobile engagement.
How to Read It Like a Human:
- The Scenario: Desktop users stay for 4 minutes and convert at 3%. Mobile users stay for 12 seconds and convert at 0.1%.
- The Human Translation: Your mobile site is broken. Maybe the calendar pop-up doesn’t work on iPhone. Maybe your 4K drone video is choking their 4G data connection. You are effectively locking the front door for 50% of your guests.
The Fix: Test your site on an actual phone—not the “mobile view” on your laptop. If you tap “Book” and have time to take a deep breath before the page loads, you are losing money. Compress your images and simplify your mobile scripts.
The Bottom Line: Data is Empathy
When we look at spreadsheets, it’s easy to forget there are real people behind those numbers.
A “bounce” is a person who got frustrated. A “checkout abandonment” is a person who got confused/surprised.
At Razib Marketing, we don’t just fix “metrics.” We fix the experience. We smooth out the carpet so your guests don’t trip on their way to the front desk.
Is your website silently chasing guests away? Let’s stop the walk-outs. Book a Free Analytics Audit with us, and let’s find out exactly where your revenue is hiding.